What reports can ScreenJournal generate?
Updated on 14 September 2026
ScreenJournal builds team reports from the work itself. The Reports page produces three downloadable Excel workbooks, for productivity, attendance and app usage, over any range you choose; the Overview page answers "how is the team doing" live for a day, week, month or custom range; and the Ranking page is the weekly league table. Because every number derives from AI-written work timelines, the reports describe real output, not screenshots or activity percentages.
Most team reporting is assembly work: a manager stitches together dashboards, ticket queues, memory and a few pings, then writes the summary by hand. ScreenJournal removes the assembly. It already writes a work timeline for each person as work happens, so a report is simply that record, organised around a question a manager actually has.
What reports are available?
Three workbooks, each answering a different management question from the same underlying record of real work, plus two on-screen views.
| Report | The question it answers | Shape |
|---|---|---|
| Productivity report | What did each person and team actually produce? | One sheet per working day plus a range summary; productive vs unproductive time per person; up to 180 days |
| Attendance report | Who worked, when, and how consistently? | One sheet, people by days, each cell that day's productivity score, plus a productivity column; up to 45 days |
| App usage report | Where did the tracked time go? | A summary plus one sheet per day: time per application for each person; up to 31 days |
| Overview (on screen) | How is the team doing right now? | Headline figures, work-time split, productivity bands, attendance calendar, presence matrix, app usage and a per-member table for any period |
| Ranking (on screen) | Who had the best week, and why? | The weekly league table with a productivity-by-day chart and an AI-written summary per member |
A single member's workbook for any period is one click away too: Download Excel on that person's Overview screen. Pay figures live on the Timesheet instead, exported as CSV.
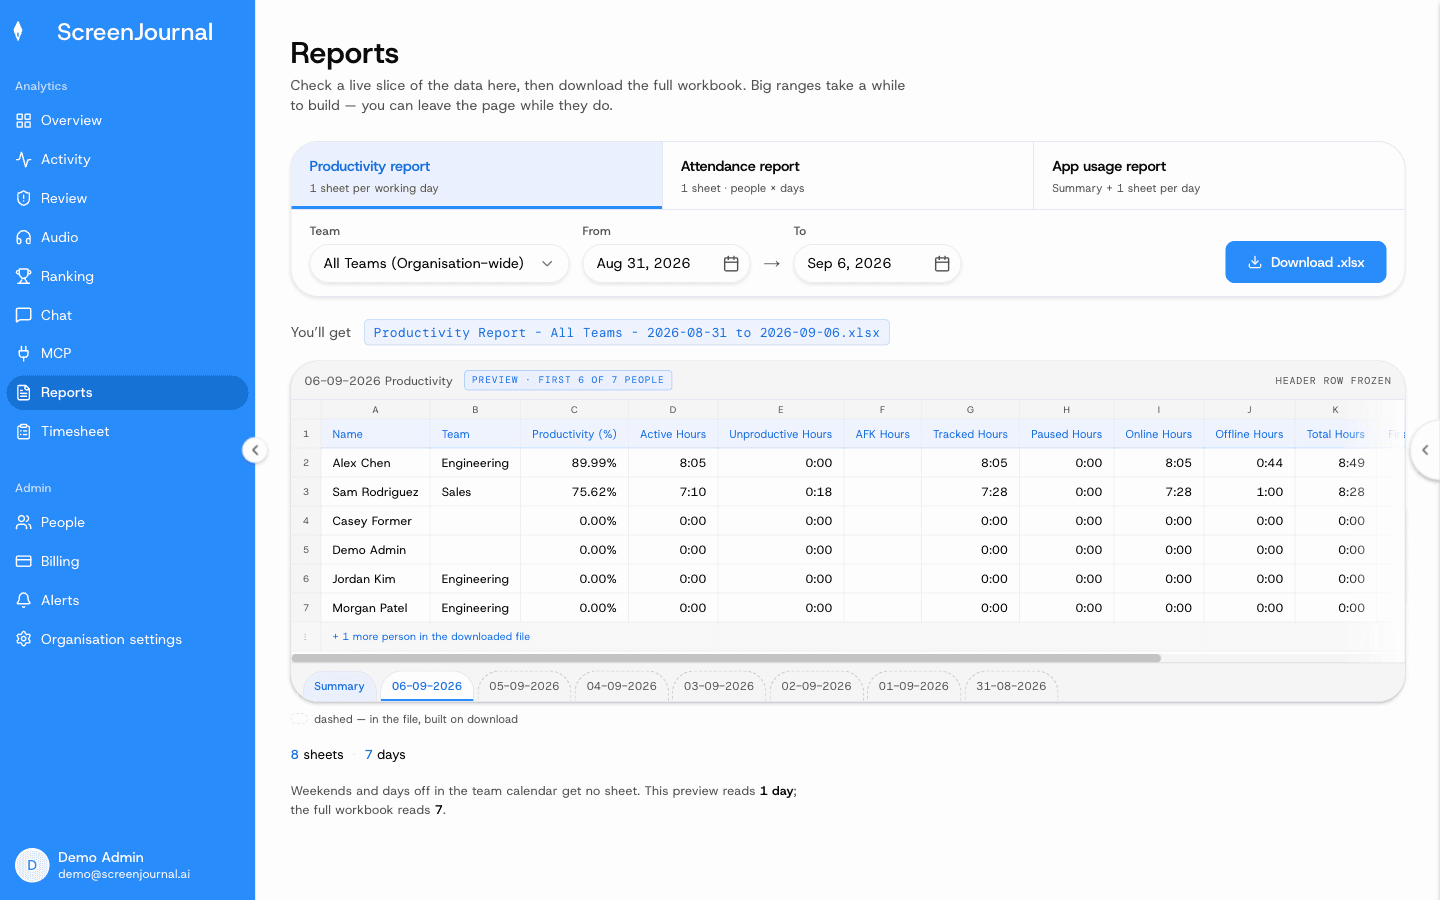
Proof: the Reports page, with the report chooser, scope and date range, and a live preview of the workbook before download.
How does ScreenJournal generate reports?
Reports are generated in three steps, and none of them involves anyone filling in a form. First, ScreenJournal reads on-screen work as it happens and writes a timeline for each person: apps, durations, plain-English descriptions and scores. Second, by default the raw screen data is deleted during processing (a manager can opt in to Evidence Mode to keep video evidence), and every report reads from the derived record, never from footage. Third, you choose the report, the scope (a team, the whole organisation, or your reportees) and the date range; the page shows a real slice of the file, with a definition and formula under every column header, and Download .xlsx builds the workbook.
Arriving from Overview's Download reports button pre-fills the range you were already looking at. A range past a report's limit is refused with an explanation before anything is fetched.
Is there a weekly report?
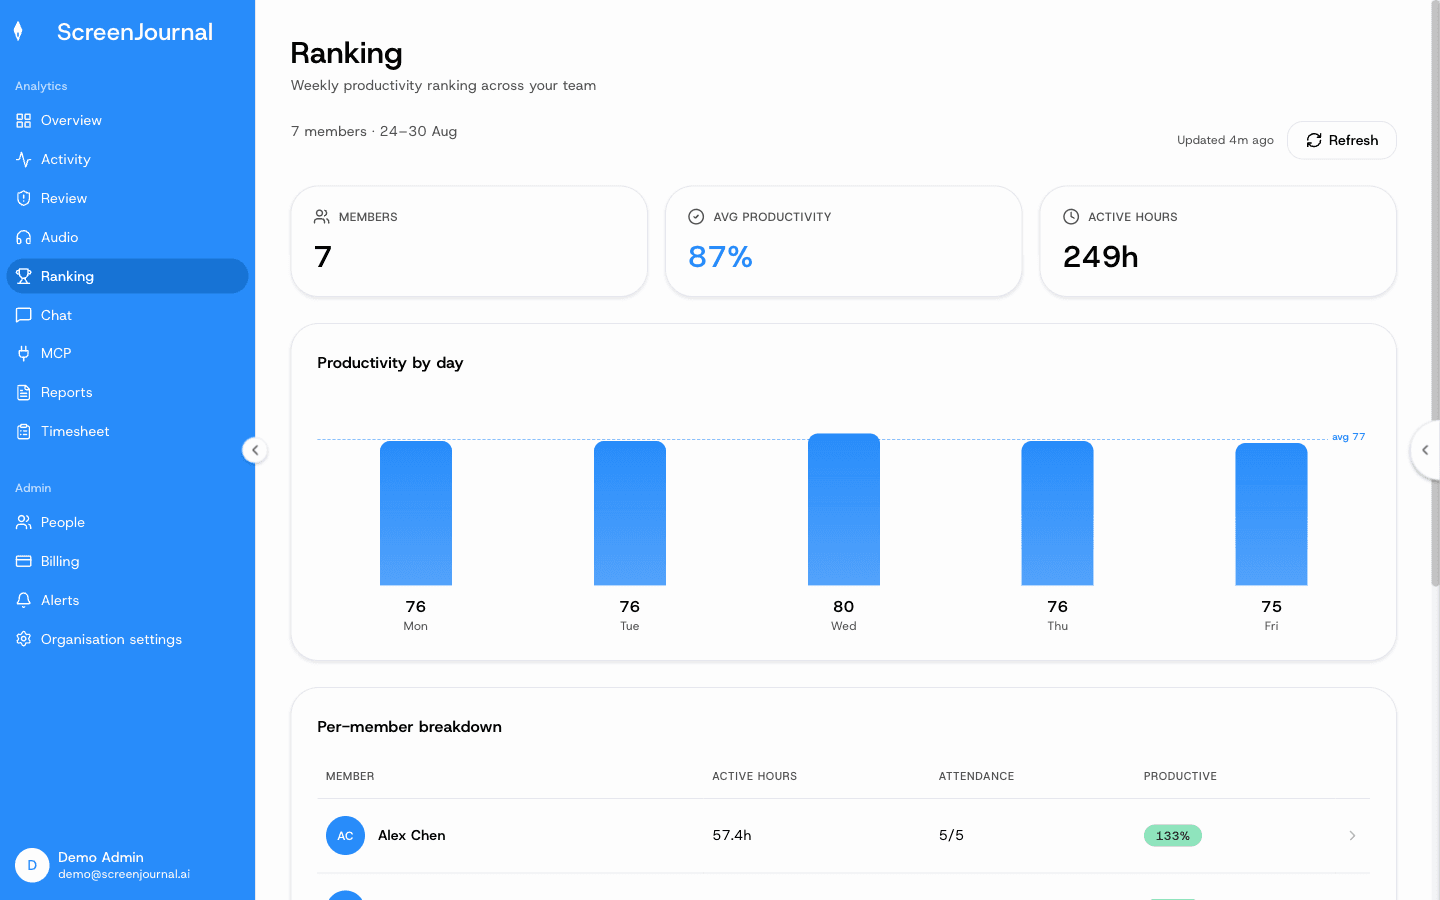
Yes, on screen. The Ranking page is the weekly league table: members, average productivity and active hours for the week, a productivity-by-day chart, and a per-member breakdown with active hours, attendance and productivity. Select a member to read an AI-written summary of their week against the team, with their day-by-day timeline underneath.
Proof: the weekly Ranking, with the productivity-by-day chart and the per-member breakdown.
What do the numbers mean?
The same definitions apply on every page and in every export. The AI rates each recorded segment from 1 to 5; the dashboard shows that as productive, neutral, low or distraction. A person's productivity for a day or period is weighted productive hours divided by an 8-hour workday, with productive segments counting in full, neutral segments half and unproductive segments not at all. It is not "active time divided by tracked time". Attendance counts the days a person was present out of the working days in the organisation's calendar, so a Saturday that is not a working day never counts as an absence.
How is this different from an employee activity report?
An activity report scores how busy the tools looked: which apps were open, which sites were visited, how often the mouse moved. A ScreenJournal report describes what was produced, because it is generated from the work itself. The distinction matters because activity is a proxy that fails in both directions: time in the right apps counts as productive even when nothing is produced, and focused, low-click work looks idle. Reports built on output do not inherit those errors. For the fuller picture of how the approaches differ, see ScreenJournal vs the alternatives.
What if the report I need is not in the list?
Ask the question directly. The Assistant chat (Ask AI) opens beside any page of ScreenJournal and answers in plain English from the derived record, not footage: who is stuck, what is about to slip, where the hours went last month. It looks up real data before answering, shows what it consulted, and can include a chart or a downloadable file in its reply. And because timelines accumulate into a searchable chronicle, past work is as answerable as this week's; questions can also be asked from your own AI tools through the ScreenJournal MCP, permission-scoped by role. The workbooks and dashboards handle the recurring cadence; Ask AI handles everything in between.
Who are these reports for?
Managers of remote, hybrid, offshore and BPO teams get the Monday picture without building it, in time for the day's first conversation. Team managers see their own team; reporting managers see their reportees; owners, admins and managers see the whole organisation. Operations and finance get attendance and app-usage rollups from the same record the timesheets come from. Viewers can read every dashboard but, being read-only, cannot generate files.
Employees are not on the outside of any of this. They see the same activity view managers do, their own Overview screen shows the same daily figures the team reports use, an admin can correct a score the AI misread, and segments can be redacted when the organisation grants that permission. A report generated from real work is also the report that finally makes quiet, productive weeks visible.
Reports FAQs
Is there a weekly report?
Yes, on screen. The Ranking page is the weekly league table: members, average productivity and active hours for the week, a productivity-by-day chart, and a per-member breakdown with active hours, attendance and productivity. Select a member to read an AI-written summary of their week against the team, with their day-by-day timeline underneath.
Do I have to build the reports myself?
No. You choose which report, whose data and which days; ScreenJournal builds the workbook and shows a preview of the real sheet before you download it. Overview and Ranking need nothing at all: they are already on screen when you sign in.
Do reports include screenshots?
No. ScreenJournal takes no screenshots and, by default, deletes raw screen data during processing, so there is no footage for a report to include. Every report is built from the derived timelines, including where a manager has opted in to keep video evidence for up to 3 months.
Can employees see the data behind the reports?
Yes. Employees see the same activity view managers do, and their own Overview screen shows the same daily figures the team reports use. An admin can correct a score the AI misread, and segments can be redacted when the organisation grants that permission.
What is ScreenJournal?
ScreenJournal is an AI work visibility tool that reads on-screen work as it happens, turns it into a detailed timeline of what each person actually did, and then, by default, deletes the raw screen data. Timelines accumulate into a searchable chronicle of everyone's work history, and from them ScreenJournal generates timesheets and reports automatically and drafts standup summaries on request, answering questions about any of it in plain English.
See the work itself, not screenshots of it
Timesheets, reports and answers from the work your team actually did. Available for Windows and macOS, with Linux and mobile support coming soon.